
Composite KPIs: what they are and why you should never read one alone
A composite KPI is one number built from several simple ones. Altman’s 1968 Z-score is the most famous case; OEE, RevPAR or revenue per available hour are the everyday ones. The number says how things are going, the parts say why.
What is a composite KPI? Let’s start with the most famous case.
Altman’s Z-score, 1968
In 1968, Edward Altman, then a finance professor at NYU, published in the Journal of Finance a score to predict corporate bankruptcy. Until then, analysts mostly looked at one ratio at a time. He asked: what if we look at them all together?
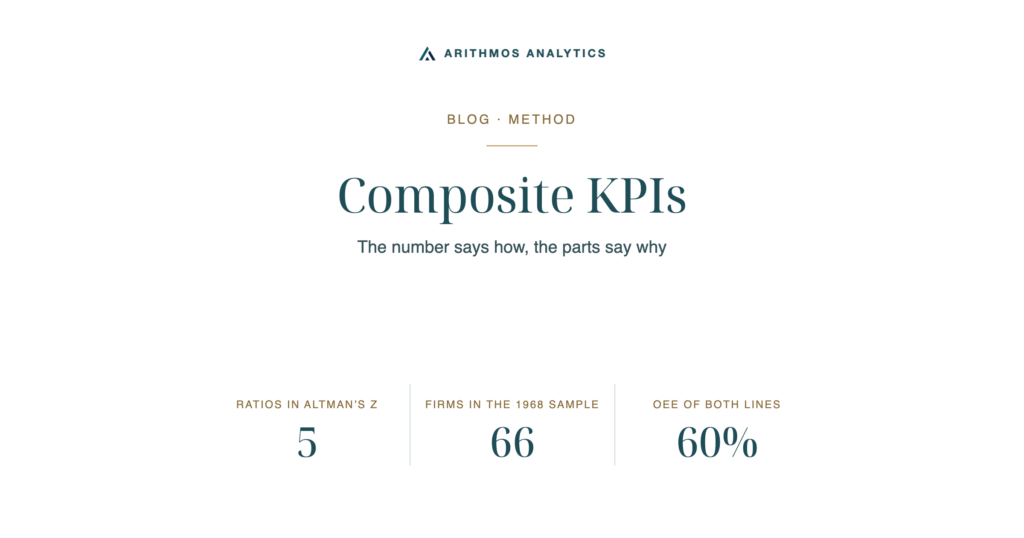
He took 66 manufacturing companies, half bankrupt and half healthy. With a statistical method called discriminant analysis, he worked out how much weight each ratio should get to separate the two groups as well as possible. He kept five: liquidity, retained earnings, operating profit and sales (each against total assets), and the market value of the shares against debts. The result is one number, the Z. Above 2.99 the company is considered safe, below 1.81 in distress, and in between sits the grey zone.
What we learn
A composite KPI has three ingredients: simple numbers, weights and thresholds. The weights and thresholds come from one specific sample. Altman’s was made of manufacturers, and Altman himself later developed separate versions for private companies and for non-manufacturers, precisely because the original weights do not transfer. In a hotel or a consulting firm, the same weights don’t hold.
Most composite KPIs are far less complicated: two or three numbers multiplied together. A few, by sector:
- Finance: return on equity, DuPont style = net margin × asset turnover × leverage.
- Manufacturing: OEE = availability × performance × quality.
- Retail: revenue per visitor = conversion rate × average basket. GMROI, gross margin per euro of inventory = gross margin % × inventory turnover.
- Restaurants: RevPASH, revenue per available seat hour, which depends on how full the seats are, how fast tables turn and the average check. Prime cost = food + labour, as a share of revenue.
- Hotels: RevPAR = occupancy × average daily rate. GOPPAR = gross operating profit per available room.
- Professional services: revenue per available hour = utilisation × billing rate.
- Agriculture: revenue per hectare = yield per hectare × selling price.
Same number, different story
Let’s check an example with two production lines (invented numbers).
- Line A: available 90% of the time, running at 70% of its speed, 95% good parts. OEE: about 60%.
- Line B: available 70% of the time, running at 90% of its speed, 95% good parts. OEE: about 60%.
Same number, different story. Line A rarely stops but runs slow. Line B runs fast but stops often. Different cause, different fix.
My rule, in three steps
- A composite KPI always comes with its parts.
- It’s compared with businesses of the same sector and size.
- When the number moves, first check which part moved.
The number says how things are going. The parts say why.
A question for anyone running a small business: which summary number do you look at every month, and do you know which parts it is made of?
Source: Altman, E. I. (1968), “Financial Ratios, Discriminant Analysis and the Prediction of Corporate Bankruptcy”, The Journal of Finance, 23(4), 589–609.