
Structured business analysis
Data describes. Arithmos connects.Understand what is changing before it becomes a problem.
Arithmos Analytics turns simple business data into KPIs, relevant comparisons, diagnosis and understandable operating priorities.
Enter raw data and documents; Arithmos handles calculations, ratios and interpretation.
Selected periodAnalysis dashboard
6M · EXAMPLE
JAN — JUN+8.4%
Priority diagnosis
Revenue growth is not offsetting the increase in labour hours and variable costs.
Simple data, complete analysis
The business provides operating information; Arithmos builds the reading, indicators and ratios.
Relevant comparisons
Analysis considers vertical, business type, size, location and operating model.
From measurement to action
Diagnosis links deviations, probable causes and verifiable priorities.
In brief
Arithmos Analytics is a business analysis service for SMEs. It collects your business documents in a dedicated chat group, reads and checks them, calculates indicators with fixed rules, and delivers a report with benchmarks, diagnosis and priorities. It covers five verticals (food service, retail, services, hospitality, agriculture) in seven languages.
The problem
The numbers exist, but they often do not speak to each other.
Invoices, costs, hours, revenue and documents describe the business. Without one reading, it is difficult to see what works, where margin is lost and what needs attention.
Data spread across spreadsheets, systems and documents
Indicators calculated irregularly or without a consistent basis
Generic comparisons that ignore the type of business
Problems detected only after they have affected results
A consistent reading across data, comparison and diagnosis.
Arithmos Analytics organises information, applies consistent calculation rules and returns a report highlighting trends, deviations, probable causes and priorities.
1
Data2
KPIs3
Comparison4
Diagnosis5
Report
How it works
You send what you have. Arithmos builds the analysis.
There are no forms to fill in every month: documents arrive the way you already produce them, and the reading, checking and calculation is our job.
01
We define your business
A one-time setup sheet: vertical, opening hours, services and how your costs should be classified.
02
You send documents to the group
Receipts, till closings, invoices, PDFs, Excel files: send them to the chat group dedicated to your business, whenever it suits you.
03
An assistant reads, a person checks
The assistant reads and classifies, and flags what it cannot read instead of guessing. A person at Arithmos checks before any figure enters the numbers.
04
Report and benchmark
Fixed-rule calculations, comparison with similar businesses, diagnosis and priorities. A report every month; a conversation when needed.
What we can readPhotos of receiptsTill closingsElectronic invoices (XML)Delivery notesPDFExcelZip folders
Data and security
Your data does not live on a website.
The analysis runs on a private server dedicated to Arithmos. This website, the one you are reading, holds no client data.
How we protect the work
WhereA private server dedicated to Arithmos, in Germany, within the European Union.
AccessThe server is administered only over an encrypted private network: no public administration access.
BackupsRegular backups, encrypted before they leave the server.
CalculationsRun by fixed rules, not estimated by a language model: the same input always gives the same result.
Artificial intelligenceUsed to read documents and explain results. It does not decide: every reading is checked by a person before it enters the numbers.
Five verticals
Each business is analysed with fields and logic suited to its sector.
A restaurant is not measured like a hotel, nor a shop like an orchard. Five demonstration dashboards, built with our real engine on invented businesses.
Food & Beverage
Economic and operational analysis for businesses selling food, drinks, table service, takeaway or delivery.
Included businesses
- Bars, cafés and bakeries
- Restaurants, pizzerias and trattorias
- Pubs, breweries and quick-service formats
Retail
Sales, margin, stock, productivity and mix analysis for shops operating through one or more channels.
Included businesses
- Clothing and accessories
- Specialist and beauty retail
- Home, gifts and local products
Services
Revenue, hours, capacity, staff and profitability analysis for appointment- or project-based businesses.
Included businesses
- Salons, studios and beauty centres
- Professional and technical services
- Personal care and local services
Hospitality
Occupancy, revenue, cost and productivity analysis for independent and hybrid accommodation businesses.
Included businesses
- B&Bs and guest houses
- Independent hotels and residences
- Agritourism and distributed hospitality
Agriculture
Economic and production analysis for farming businesses, from crops and livestock to processing and direct sales.
Included businesses
- Farms and livestock operations
- Wineries, mills and dairies
- Direct sales and farmers markets
Bars, restaurants, pizzerias, venues
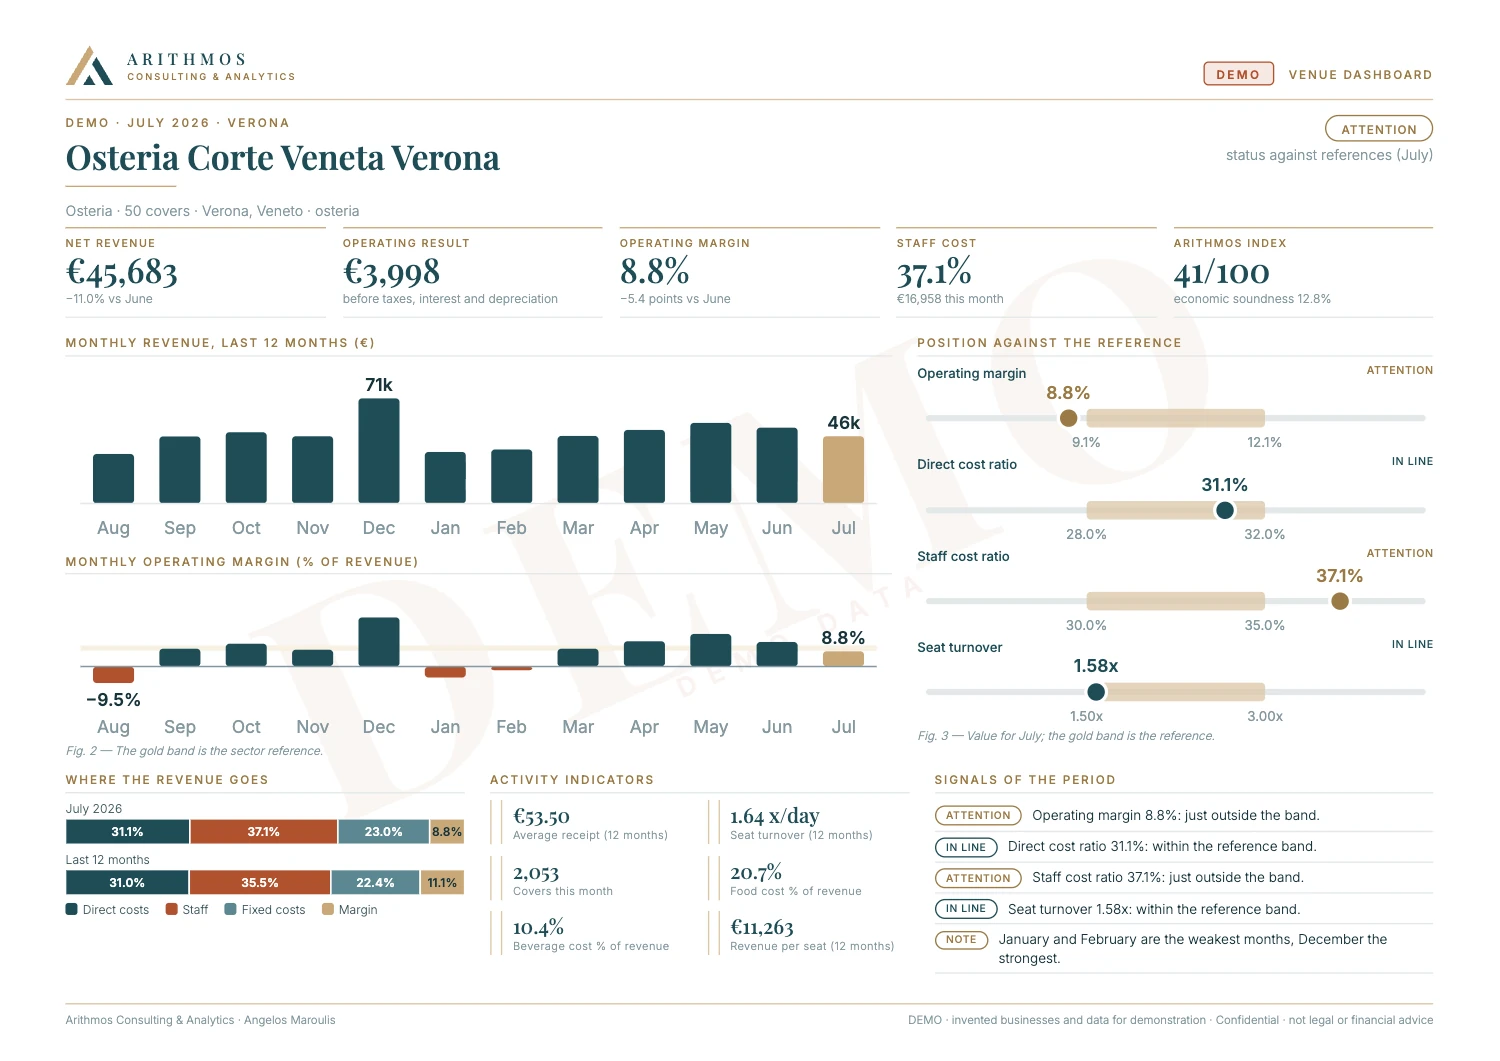
Osteria Corte Veneta, Verona
A 50-seat osteria read month by month: what is left after direct costs, staff and overheads, and where it sits against sector benchmarks.
- Average ticket and covers
- Seat turnover
- Food and beverage cost ratio
Clothing, specialist shops, home
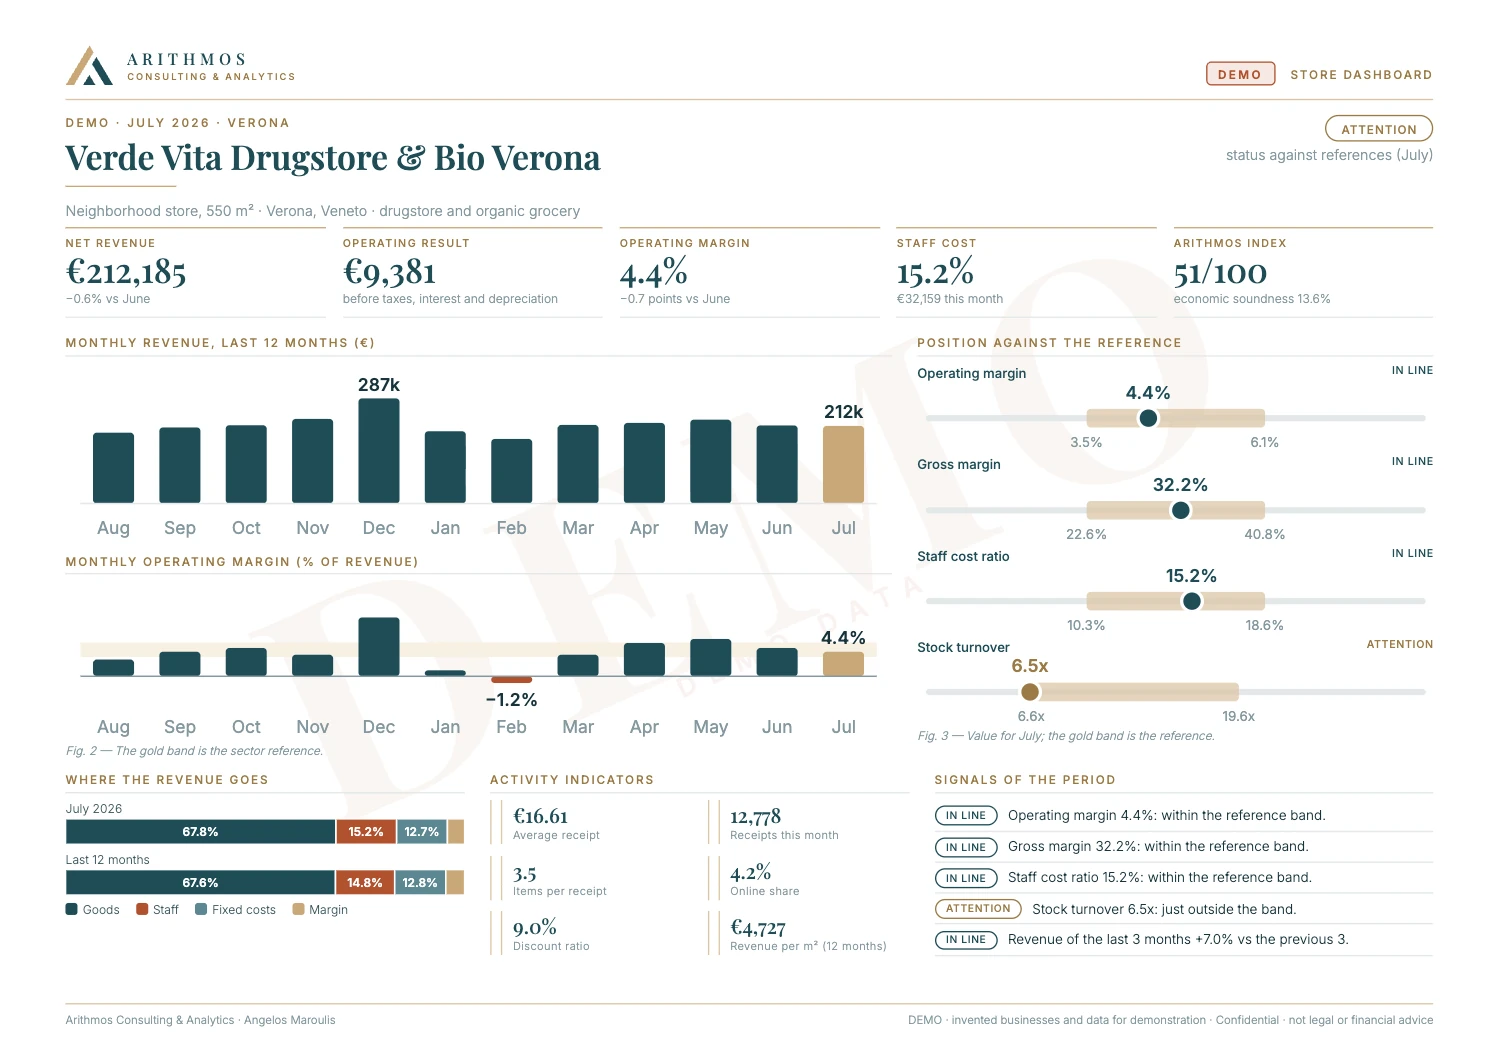
Verde Vita Drugstore & Bio, Verona
A 550 m² store read for space productivity, gross margin and stock turnover.
- Revenue per square metre
- Gross margin and stock turnover
- Average ticket and items per ticket
Salons, studios, personal services
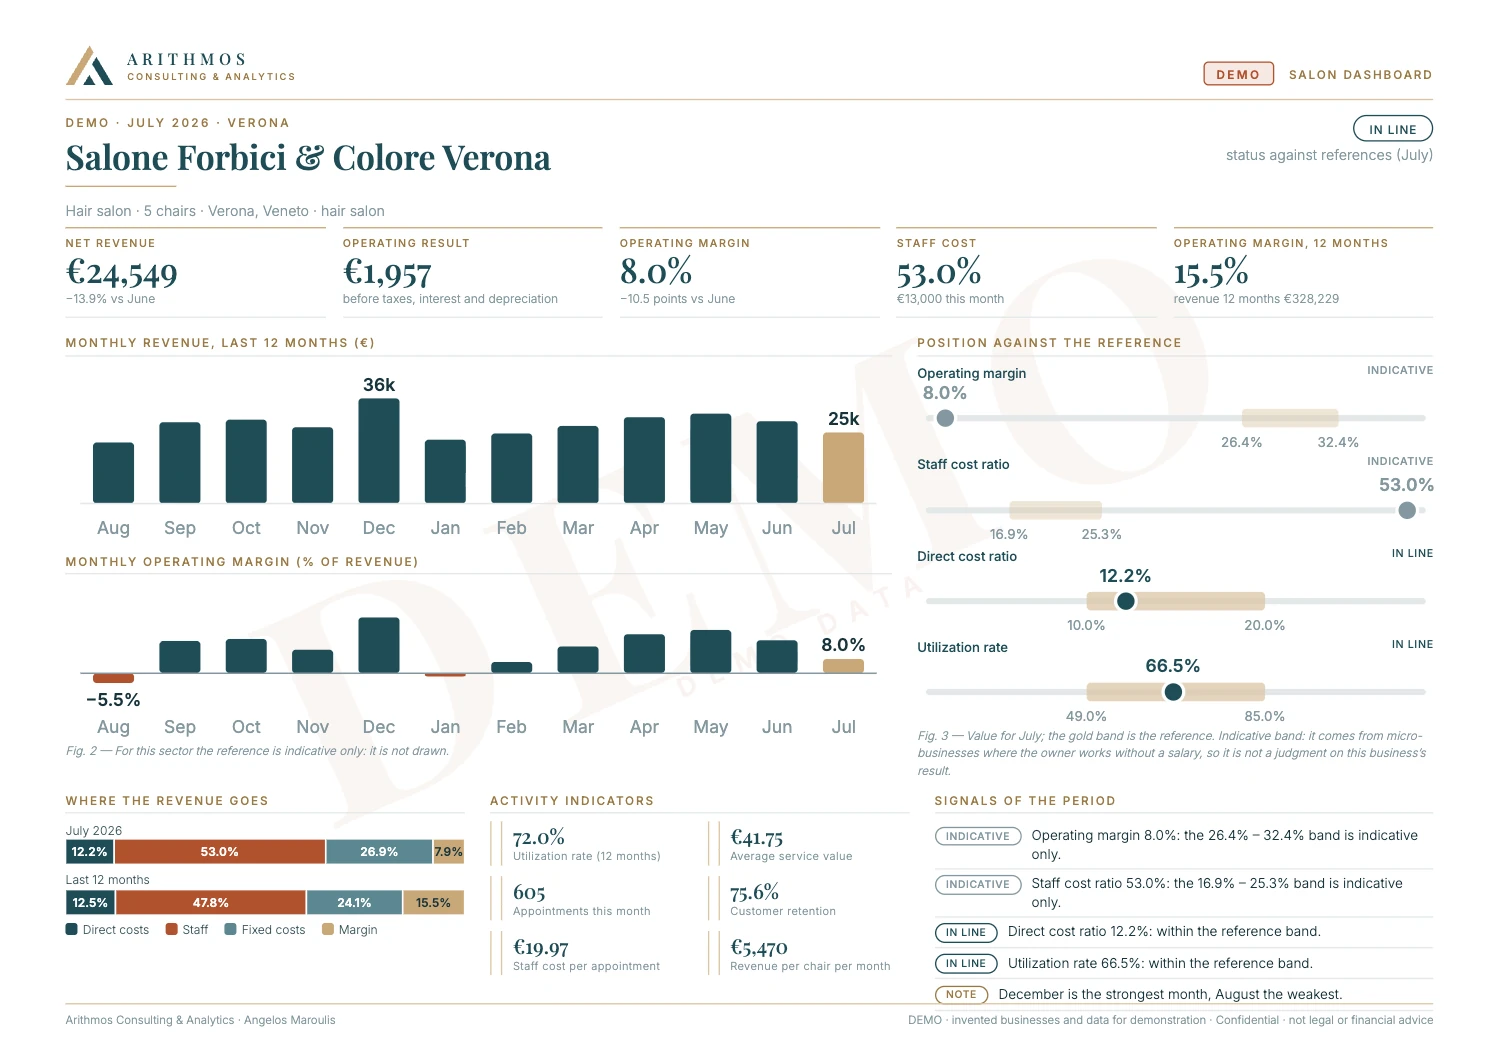
Salone Forbici & Colore, Verona
A five-chair salon: how much of the available time turns into revenue, and how much staff weighs.
- Utilisation rate
- Revenue per chair
- Staff cost ratio
B&Bs, hotels, residences, farm stays
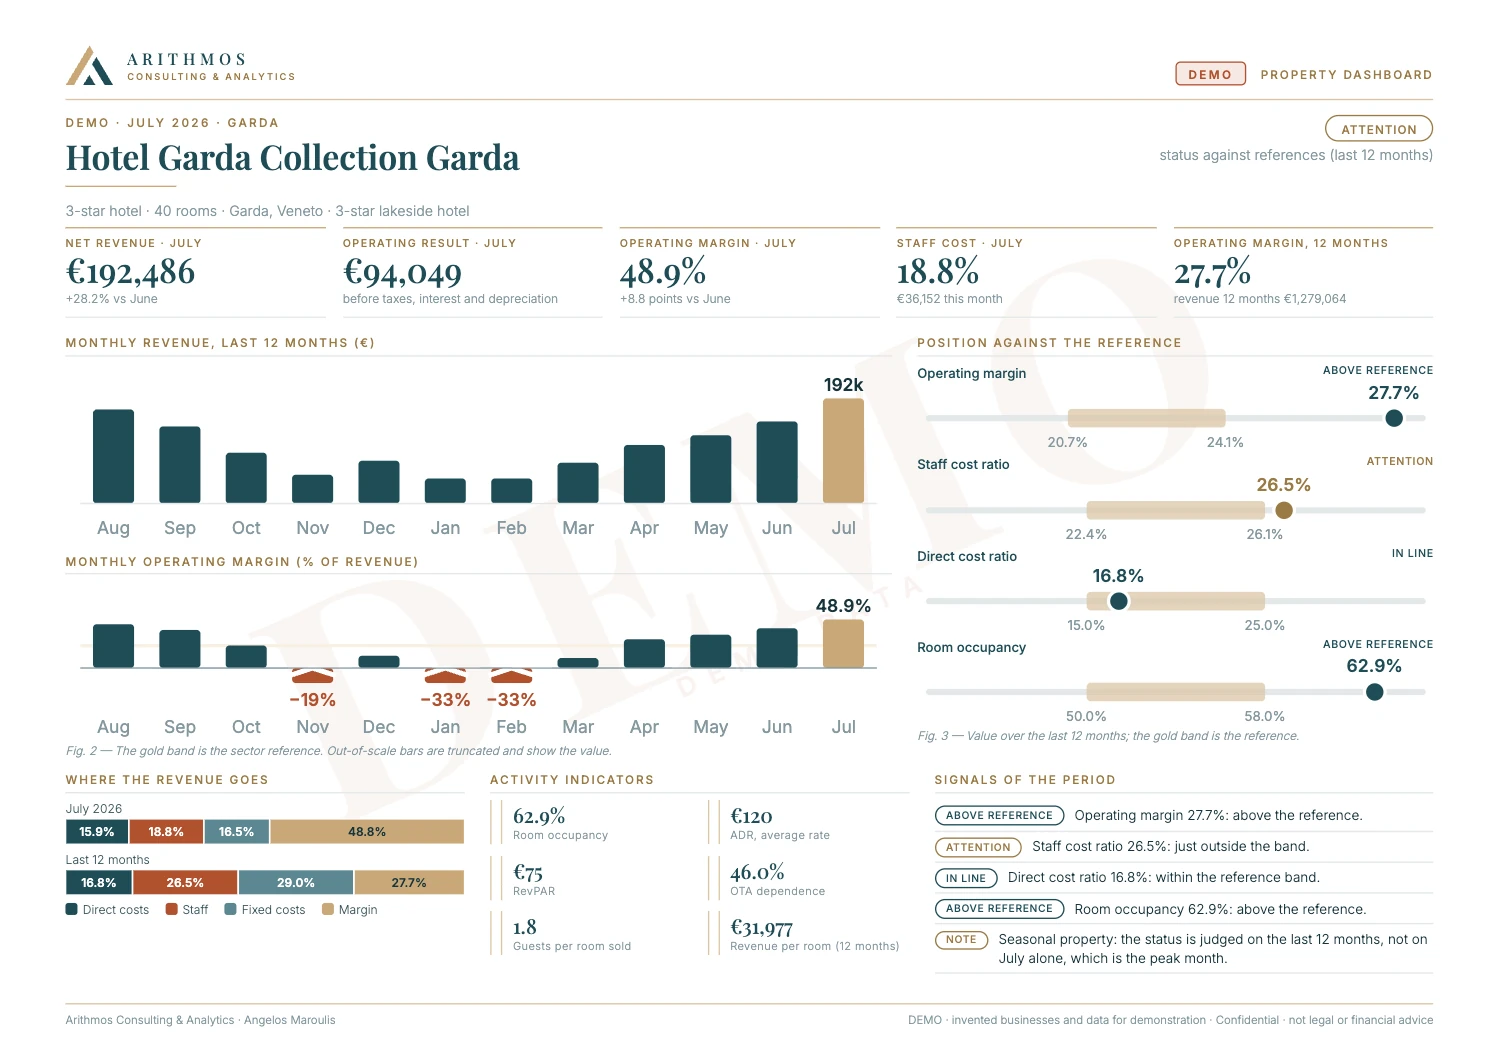
Hotel Garda Collection, Garda
A 40-room hotel assessed over the last twelve months, not a single month, because hospitality lives by seasons.
- Occupancy, average rate and RevPAR
- Dependence on online agencies
- Revenue per room sold
Farms, wineries, direct sales
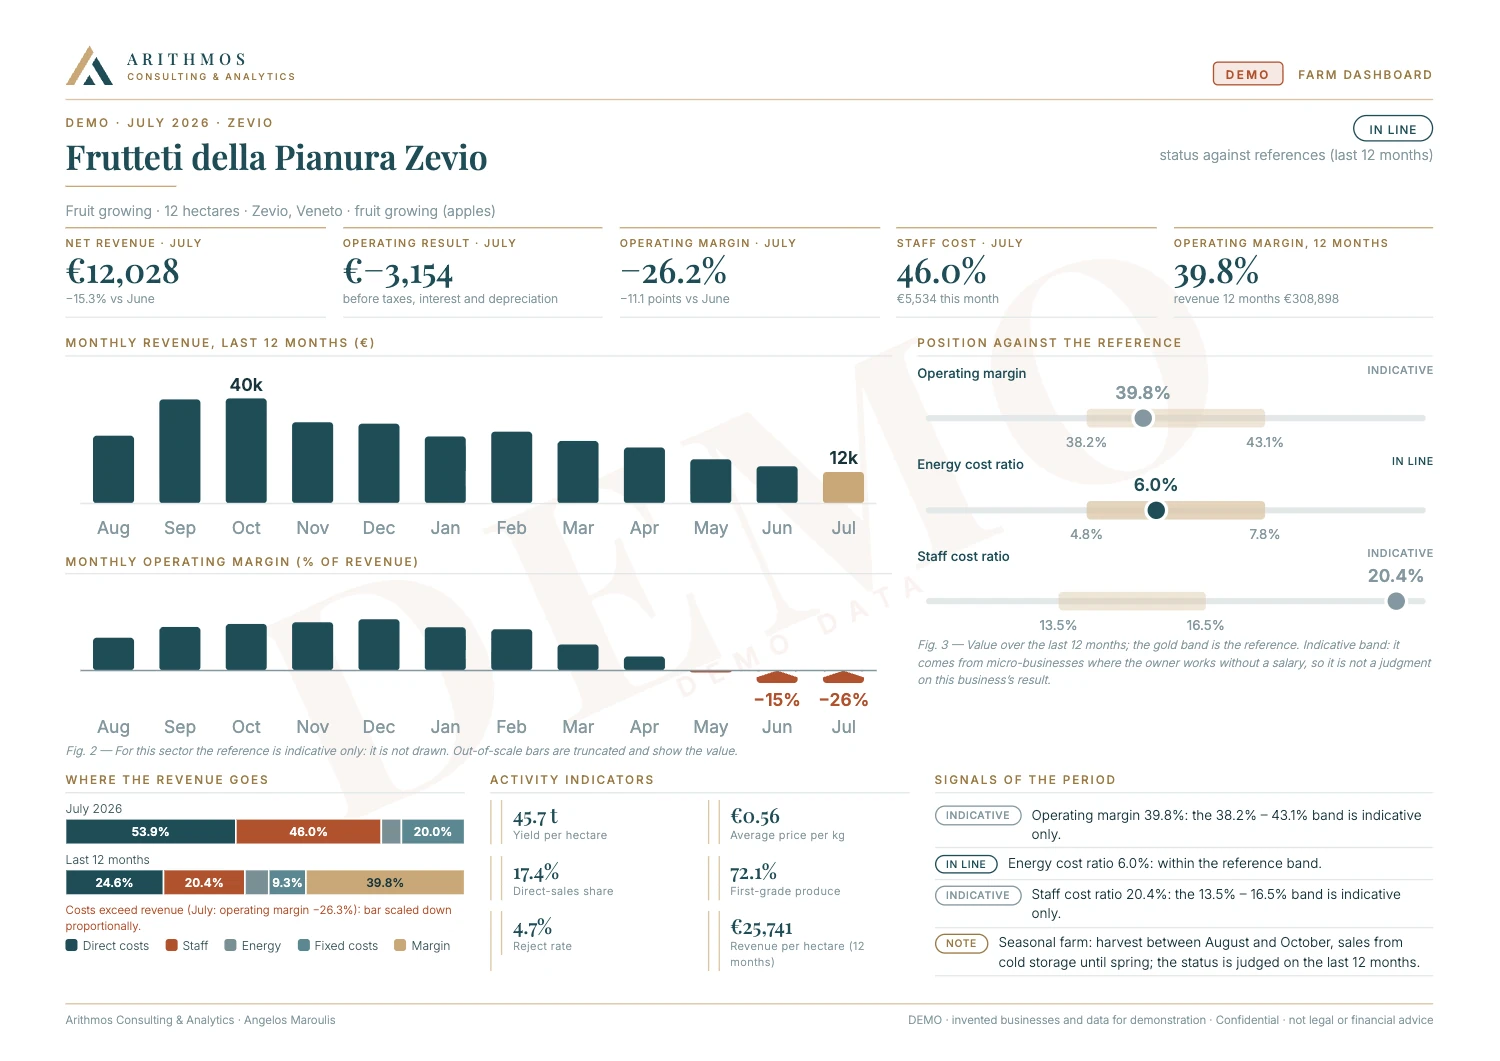
Frutteti della Pianura, Zevio
A 12-hectare orchard: the months outside harvest show a negative result, and that is correct. That is why the analysis looks at twelve months, not July.
- Revenue per hectare
- Average price and waste rate
- Harvest seasonality
Several sites, one view
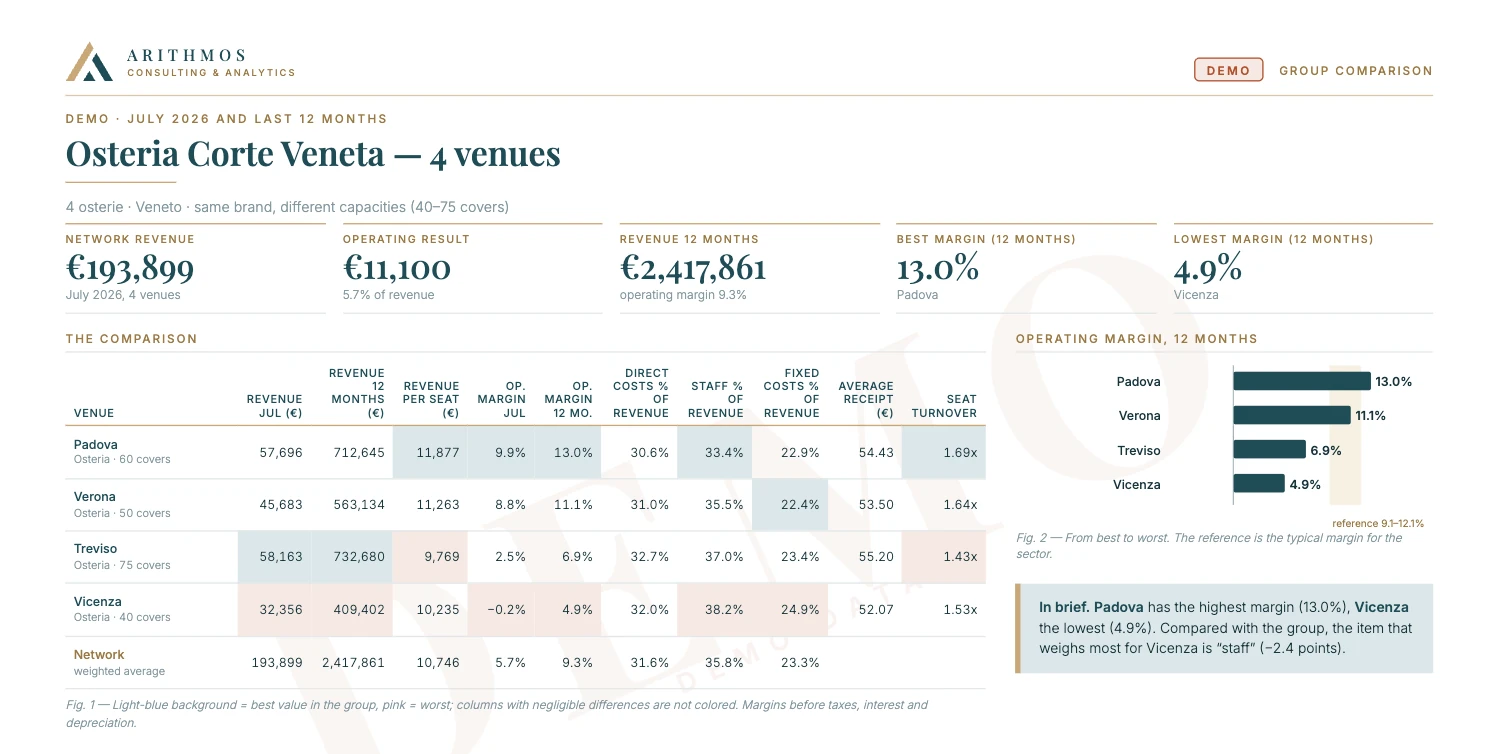
Which site earns the most? And why?
If you have several venues, shops or properties under the same brand, the group comparison puts them on one page: where margin is highest, where staff weighs most, what differs from the network average.
Inside the analysis
Not just a dashboard, but a route from measurement to decision.
Arithmos engines keep calculation, comparison, diagnosis and reporting separate, so every result can be explained and updated.
Calculation and trends
Economic and operating indicators built from raw data, with consistency checks and time comparison.
- Margins and cost ratios
- Productivity and capacity
- Monthly and annual trends
Tailored comparison
Comparison avoids overly broad averages and focuses on genuinely comparable businesses.
- Vertical and business type
- Location and size
- Services and operating model
Diagnosis and priorities
Deviations are linked to probable causes, risks and actions to verify.
- Explained causes
- Ranked priorities
- Actions with owner, measure and timing
Why it’s tailored
Every business is different — that’s why generic formulas don’t work.
Two businesses in the same sector can have completely different margins, seasonality and cost structures. That’s why the analysis — and the quote behind it — come from a real conversation, not a price list.
Sector and business type
Size, seasonality and channels
Cost and staff structure
Objectives and priorities for the period
Same indicator, very different businesses
Average operating margin by sector
Food & Beverage8%
Retail14%
Services24%
Hospitality19%
Agriculture11%
Frequently asked questions
The answers, before you write to us.
The shortest answers to the questions we are asked most often.
It is a business analysis service for SMEs: it turns everyday documents into indicators, comparisons with similar businesses, diagnosis and priorities, in one clear report.
In a chat group dedicated to your business: receipts, till closings, invoices, PDFs, Excel files. There are no forms to fill in every month.
An assistant reads and classifies the documents and flags what it cannot read instead of guessing. A person at Arithmos checks before any figure enters the numbers.
On a private server dedicated to Arithmos, in Germany, within the European Union, administered only over an encrypted private network. The website holds no client data.
Five verticals: food service, retail, services, hospitality and agriculture. Every business is read with the indicators of its own trade.
An ERP keeps operations in order (invoices, stock, orders) and a CRM keeps customer relationships. Arithmos Analytics takes the data you already have and puts it together: what you really earn, where margin breaks, what needs attention.
The report includes the trend of the period, cost structure, productivity, a comparison built on your type of business, an integrated diagnosis and actions ordered by priority.
No. Analytics works on its own. If you need support applying the priorities, a project with Arithmos Consulting can be arranged.
Who is behind it
A contact person, not a call centre.
The work is followed personally by Angelos Maroulis, founder of Arithmos, based in Verona.
CompanyArithmos Consulting & Analytics
VAT numberIT05186170238
OfficeVicolo Terrà 3, 37129 Verona, Italy
CoverageAcross Italy and remotely
LanguagesItalian, English, German, French, Spanish, Greek, Ukrainian
Before the analysis
Tell us about your business: we show you how Arithmos works and what you receive.
We confirm vertical, business type, available data and report language before the work begins.